Archive
Power BI and master-detail JSON
Power BI
Now a days, I am spending sizable amount of time with Power BI. Power BI is suite of business analytics tools used for discover, analyze data and share the insights. Power BI empower users and helps to deliver interactive dashboards and reports.

Power BI can combine your on premise organizational data as well as data from cloud based business apps as well. It can also combine data from various source like, databases, files, web services and can visualize the data for easy analysis.
JSON as a Data Source
I have been using NoSQLs a lot for my recent developments. These NoSQLs are storing a data in JSON format. Even when we are having integrations with frond end programs, then also we are exposing JSON data with the help of REST APIs. Knowing use of JSON at various layers within the application, I was more interested how we can consume a JSON in Power BI and how we can visualize the same.
Typically simple JSON structure can be easily transformed and data can be cleaned. But when it comes to a JSON structure with master-detail pattern, then users or data analysts may face a challenge to structure the data the way Power BI can use for analysis as well for visualization. This blog will walk you through the steps which can be carried out for master-detail pattern in Power BI from a JSON based data structure.
Master-detail JSON
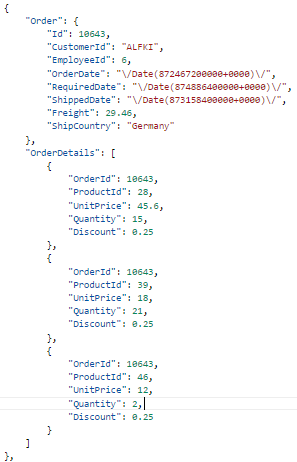
I am considering a very famous Northwind database for demonstration. Let’s consider we are storing Order and OrderDetails in a JSON format like below. This is a typical master-detail pattern.
Power BI Desktop
Power BI Desktop is a free report authoring tool. With the help of this tool, we will be getting the data from JSON and the transforming the same data for reporting purpose.
I have already saved above JSON data in orders.json file.
Now let’s follow below steps in Power BI Desktop,
1. Select Get Data option and choose JSON and click Connect.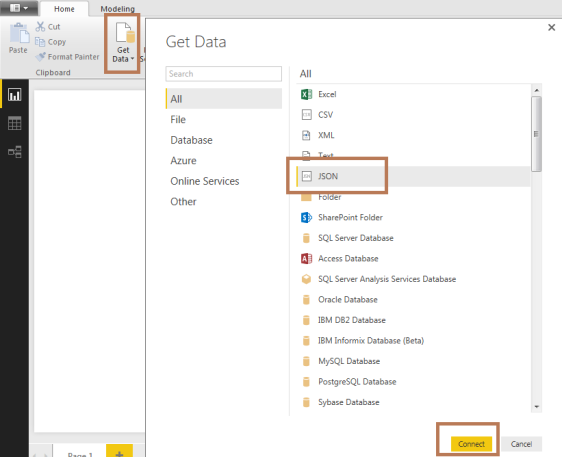
2. Select orders.json file and click Open.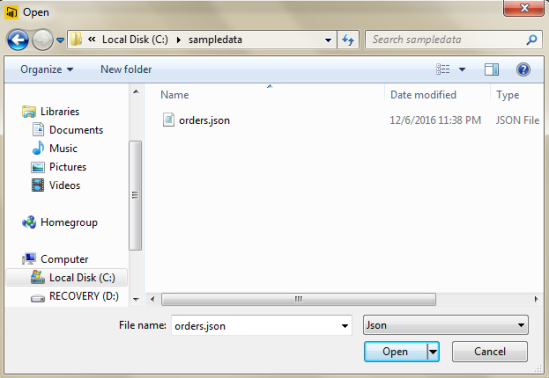
3. After opening a file, Power BI Query Editor will open directly.
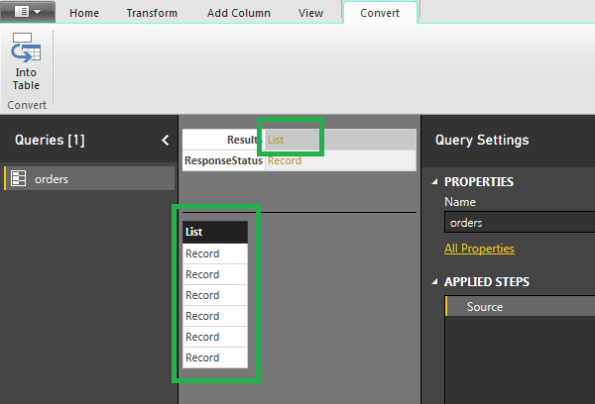
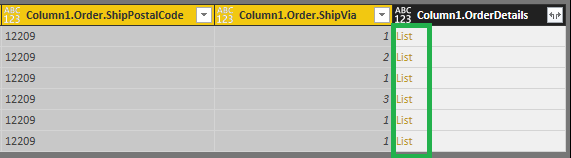
4. Click on List row from the table and see you are able to see List of records as highlighted below,
5. Now Click on option Into Table to convert this list into a record.
6. You will see a table with JSON attributes as Results and ResponseStatus as below,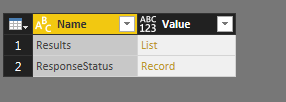
7. Click on Results to further transform this data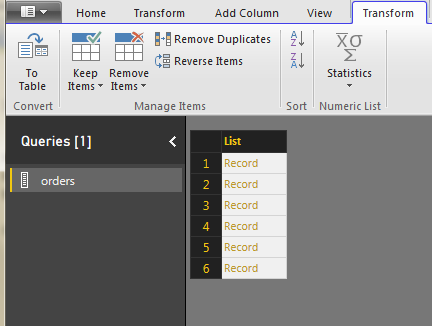
8. Click on To Table option from tab menu to launch below screen,
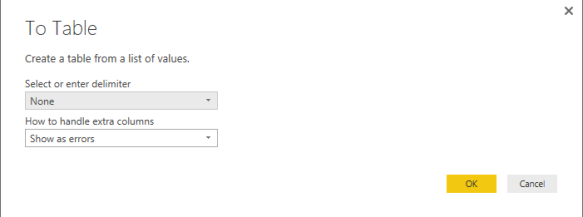
9. Click OK to see below screen where Column1 is shown with split icon
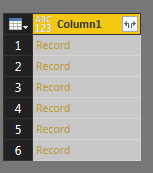
10. Click on split icon shown with two arrows at right corner to split the data using below screen
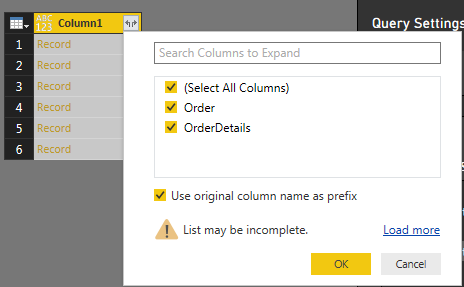
11. Select columns to be expanded and click OK and see Order and OrderDetails list has been expanded now
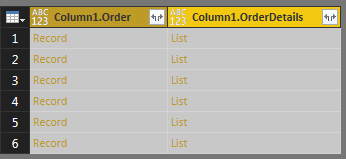
12. Now click on Column1.Order split icon and again select columns to be expanded.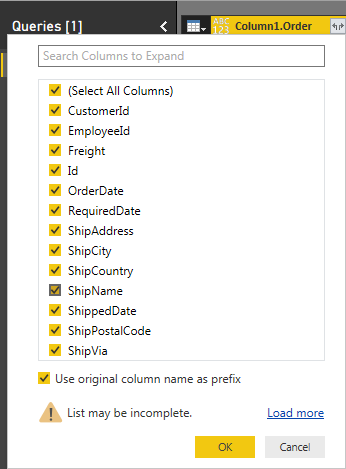
13. Once you click OK, you should see data as below,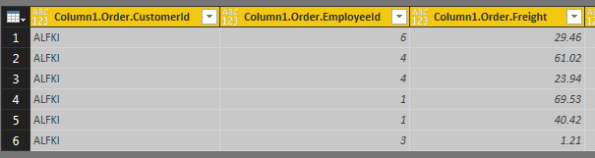
14. So far we have now expanded Column1.Order column. You can see above how column names are appearing for fields from Order. Look at now Column1.OrderDetails this is still a List type.
15. Now here is an important step, let’s add now an Index Column using Add Index Column option from Add Column tab before we transform OrderDetails.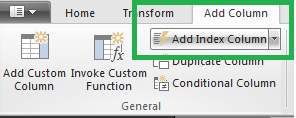
16. Once you add an index column, rows from Orders will be indexed and shown with Index column as below. This shows we have total 6 Orders in JSON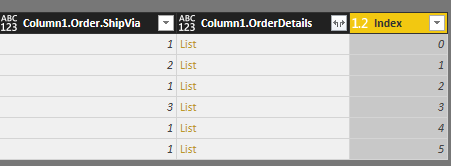
17. Now select to Column1.OrderDetails which is of type List and click on split icon to expanded records from OrderDetails as below. Here when we clicked on split icon, it duplicated Orders data along with Index column as well. Still we see Record under Column1.OrderDetails column.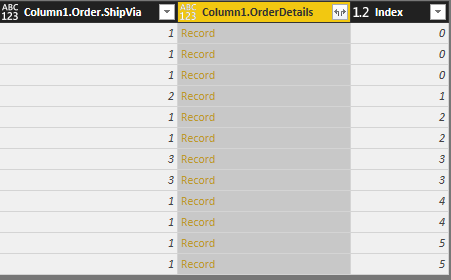
18. Click on split icon to select columns to be expanded as below.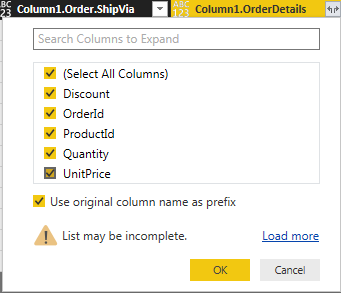
19. Click OK to expand data for selected column. Now Order and OrderDetails both data can be seen under one table as below,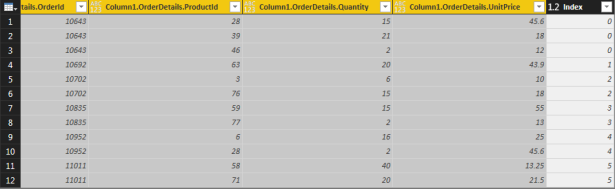
20. Let’s verify our data for each column, e.g. Column1.OrderDetails.Quantity, Column1.OrderDetails.UnitPrice are of Text Data Types. Change their data types to Whole Number and Decimal Number respectively. This is done using tab Transform > Data Type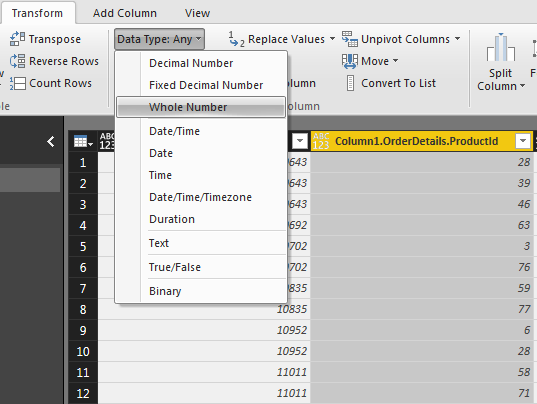
21. Now this is a like a typical flat data structure where Order data is duplicated based on records in OrderDetails for that order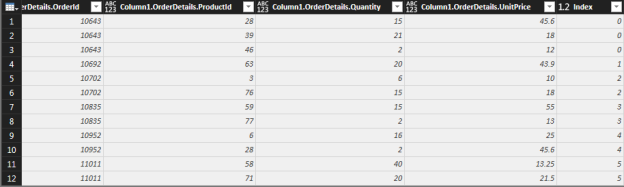
22. The best thing which I can see in Power BI is, it has tracked all the steps of transformation and can be seen at APPLIED STEPS. You can very well go back to each steps and see how transformation has been done just by clicking on these steps.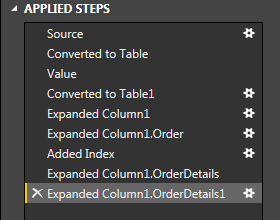
23. Now to save all the transformations done in a query form, click Close & Apply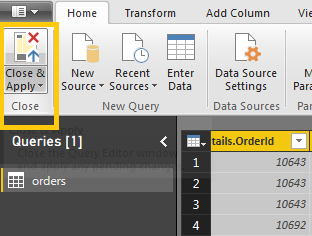
24. Select Data option table like icon as highlighted from Left Navigation of Power BI, to see flat structured data as below.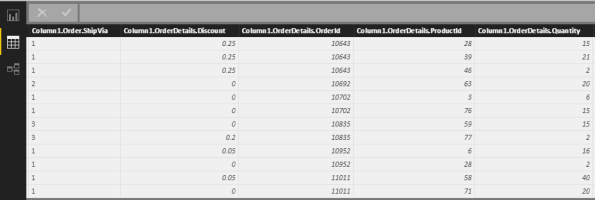 Now this data can be used for reporting purpose with all the transformations done.
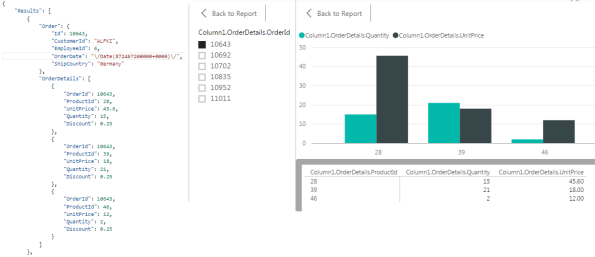
25. Just to demonstrate, I have added couple of visuals in Power BI to see how master detail records are seen. I added a slicer visual so that I can select whatever Order Number and then beside Slicer, added a Clustered Column Chart.
Now select OrderId from Slicer and see in chart data is showing ProductId, Quantity and UnitPrice for selected OrderId. Refer JSON, Selected Order and Order Details in one view side by side to verify the transformation and mapping of data.
Awesome! Keep Transforming…
My Book